记 LSPosed 的一个随机崩溃的调查过程 发表于 2024-06-27 | 更新于 2024-07-01
| 阅读量:
记 LSPosed 的一个随机崩溃的调查过程 LSPosed 已经停更数个月,由于缺少维护,问题不断显现。从上个月开始,就看到有不少用户汇报 LSPosed 存在导致系统概率性 crash 或 bootloop 的问题,然而原因却让人摸不着头脑。在最近,经过几天的与问题用户的跟踪调查,总算有了眉目。
初见 收到的 crash dump 往往具有下面的特征:
1
2
3
4
5
6
7
8
9
10
11
12
13
14
15
16
17
18
19
20
21
22
23
Process uptime: 13 s ZygotePid: 8731 Cmdline: system_server pid: 8968 , tid: 9054 , name: PackageManager >>> system_server <<< uid: 1000 tagged_addr_ctrl: 0000000000000001 (PR_TAGGED_ADDR_ENABLE) signal 11 (SIGSEGV), code 1 (SEGV_MAPERR), fault addr 0x000000000001001f x0 b400007291770600 x1 00000071 c94177c8 x2 0000000000000000 x3 0000000000000000 x4 0000000000000000 x5 0000000000000000 x6 0000000000000000 x7 00000071156e6000 x8 000000000000f fff x9 42348 aa598a9b938 x10 0000000000000001 x11 0000000002000000 x12 000000000000000 c x13 000000000000000 c x14 0000000000000003 x15 00000000 ebad6a89 x16 00000071156e4 be0 x17 0000000000000031 x18 0000007115124000 x19 00000071156e4 b20 x20 b400007146c64400 x21 b400007291811510 x22 00000071e369 d000 x23 b40000729176bc80 x24 00000071156e6000 x25 0000000000000008 x26 0000007126890898 x27 000000000000100 a x28 00000071156e4 d30 x29 00000071156e4 af0 lr 00000071e30 a85e8 sp 00000071156e4 af0 pc 00000071e30 b5448 pst 0000000080001000 36 total framesbacktrace: #00 pc 000000000042e448 /apex/com.android.art/lib64/libart.so (art::jit::JitCodeCache::IsMethodBeingCompiled (art::ArtMethod*, art::CompilationKind)+136 ) (BuildId: bfccbd9698a0ee7ef72cfa3ee7389215) #01 pc 00000000004215e4 /apex/com.android.art/lib64/libart.so (art::jit::ScopedCompilation::ScopedCompilation (art::jit::Jit*, art::ArtMethod*, art::CompilationKind)+148 ) (BuildId: bfccbd9698a0ee7ef72cfa3ee7389215) #02 pc 000000000042149 c /apex/com.android.art/lib64/libart.so (art::jit::Jit::AddCompileTask (art::Thread*, art::ArtMethod*, art::CompilationKind, bool )+76 ) (BuildId: bfccbd9698a0ee7ef72cfa3ee7389215) #03 pc 00000000007773 d8 /apex/com.android.art/lib64/libart.so (NterpHotMethod+424 ) (BuildId: bfccbd9698a0ee7ef72cfa3ee7389215)
crash 发生在系统服务,进而导致 zygote 重启。根据收集的多名用户的汇报,导致 crash 的原因无一例外,是在执行 jit 编译的时候,调用的 IsMethodBeingCompiled 函数中发生了错误的解引用,fault addr 均为 0x1001f 。
问题多发生在小米的五月补丁之后的系统上,也有一例 vivo 系统的汇报。
由于 crash 的发生具有随机性,且似乎只出现在特定系统,缺少可稳定复现的方法,导致开发者起初认为是厂商修改的问题。
静态分析 我们借助源码与反汇编进行分析。
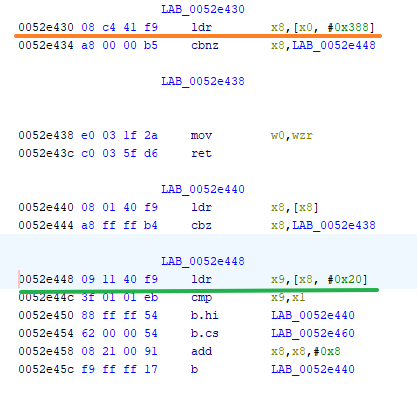
反汇编及反编译
crash 点位于绿色线部分,在解引用 x8+0x20 时候发生了错误。注意到 crashdump 中 x8 = 0xffff 。
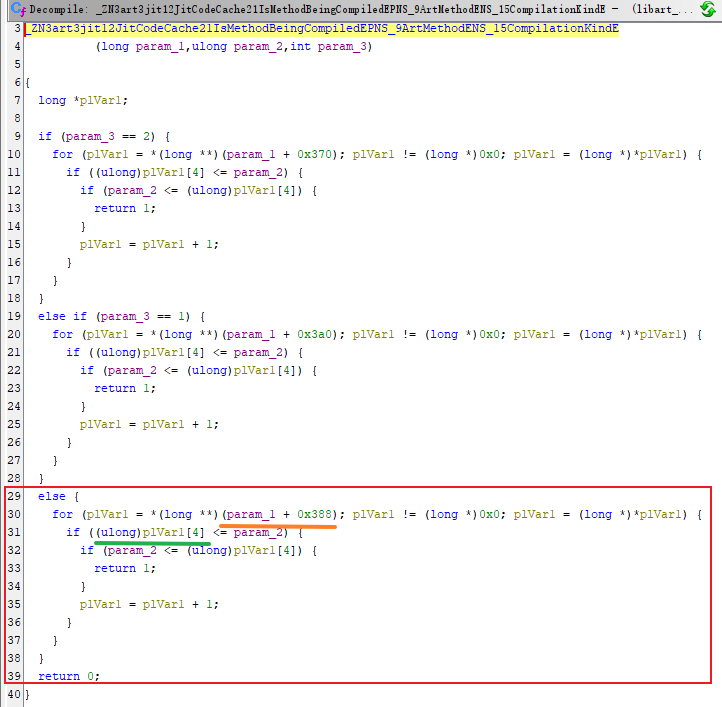
为了进一步理解反编译,我们看一看源码:
源码
https://cs.android.com/android/platform/superproject/+/master:art/runtime/jit/jit_code_cache.cc;l=1287;drc=33d57ac6d1be2127bc31fb55a5054ac84bb7d78d
1
2
3
4
5
6
7
8
9
10
11
bool JitCodeCache::IsMethodBeingCompiled (ArtMethod* method, CompilationKind kind) ScopedDebugDisallowReadBarriers sddrb (Thread::Current()) ; switch (kind) { case CompilationKind::kOsr: return ContainsElement (current_osr_compilations_, method); case CompilationKind::kBaseline: return ContainsElement (current_baseline_compilations_, method); case CompilationKind::kOptimized: return ContainsElement (current_optimized_compilations_, method); } }
current_xxx_compilations_ 是一些 std::set ,在 JitCodeCache 结构体 中。
1 2 3 4 5 6 7 SafeMap<ArtMethod*, ProfilingInfo*> profiling_infos_ GUARDED_BY (Locks::jit_lock_) ;std::set<ArtMethod*> current_optimized_compilations_ GUARDED_BY (Locks::jit_lock_) ;std::set<ArtMethod*> current_osr_compilations_ GUARDED_BY (Locks::jit_lock_) ;std::set<ArtMethod*> current_baseline_compilations_ GUARDED_BY (Locks::jit_lock_) ;
kOsr 枚举值为 0 ,因此反编译的条件分支是正确的。
1
2
3
4
5
enum class CompilationKind { kOsr, kBaseline, kOptimized, };
ContainsElement 的实现也很简单,使用 std::find 来查找某个元素是否存在。
1 2 3 4 5 6 7 8 9 template <typename Container, typename T>bool ContainsElement (const Container& container, const T& value, size_t start_pos = 0u ) DCHECK_LE (start_pos, container.size ()); auto start = container.begin (); std::advance (start, start_pos); auto it = std::find (start, container.end (), value); return it != container.end (); }
this+0x388 应该指向 std::set 的某个成员。为了分析 stl set 的内存布局,我们可以用 clang dump 出来:
1 2 3 4 5 6 7 8 9 10 #include <cstdio> #include <set> #include <algorithm> int main () std::set<long > s; s.insert (1 ); auto it = std::find (s.begin (), s.end (), 1 ); return it != s.end (); }
set 的内存布局如下:
1
2
3
4
5
6
7
8
9
10
11
12
13
14
15
16
17
18
19
*** Dumping AST Record Layout 0 | class std ::set<long > 0 | class std ::__tree<long , struct std ::less<long >, class std ::allocator<long > > __tree_ 0 | __iter_pointer __begin_node_ 8 | class std ::__compressed_pair<class std ::__tree_end_node<class std ::__tree_node_base<void *> *>, class std ::allocator<class std ::__tree_node<long , void *> > > __pair1_ 8 | struct std ::__compressed_pair_elem<class std ::__tree_end_node<class std ::__tree_node_base<void *> *>, 0 > (base) 8 | class std ::__tree_end_node<class std ::__tree_node_base<void *> *> __value_ 8 | pointer __left_ 8 | struct std ::__compressed_pair_elem<class std ::allocator<class std ::__tree_node<long , void *> >, 1 > (base) (empty) 8 | class std ::allocator<class std ::__tree_node<long , void *> > (base) (empty) 8 | struct std ::__non_trivial_if<true , class std ::allocator<class std ::__tree_node<long , void *> > > (base) (empty) 16 | class std ::__compressed_pair<unsigned long , struct std ::less<long > > __pair3_ 16 | struct std ::__compressed_pair_elem<unsigned long , 0 > (base) 16 | unsigned long __value_ 16 | struct std ::__compressed_pair_elem<struct std ::less<long >, 1 > (base) (empty) 16 | struct std ::less <long > (base) (empty) 16 | struct std ::__binary_function_keep_layout_base<long , long , _Bool> (base) (empty) | [sizeof =24 , dsize=24 , align=8 , | nvsize=24 , nvalign=8 ]
长度为 24 ,恰好与代码中三个偏移 0x370, 0x388, 0x3a0 的间隔一致,且 param_3 (CompilationKind) 与三个 set 在 JitCodeCache 中的对应顺序也一致。
p1Var[4] 也就是 *(p1Var + 32) ,应该对应于 stl set 的红黑树结点的 value 。内存布局印证了这一猜想。
1
2
3
4
5
6
7
8
9
10
11
*** Dumping AST Record Layout 0 | class std ::__tree_node<long , void *> 0 | class std ::__tree_node_base<void *> (base) 0 | class std ::__tree_end_node<class std ::__tree_node_base<void *> *> (base) 0 | pointer __left_ 8 | pointer __right_ 16 | __parent_pointer __parent_ 24 | _Bool __is_black_ 32 | __node_value_type __value_ | [sizeof =40 , dsize=40 , align=8 , | nvsize=40 , nvalign=8 ]
p1Var 可以看作遍历红黑树结点的指针值。目前我们尚不知道哪一个值传入会导致 crash ,也不知道是在循环的哪一层读取到了错误的地址。
不过回到 crashdump 中,我们注意到了:
1
2
3
4
5
6
memory near x0 = b400007291770600 ([anon:libc_malloc]): 00000072917705e0 0000000000040007 0000006575727408 .........true ... 00000072917705f 0 0000000000000000 0000000000000000 ................ 0000007291770600 6f 632f7865706101 00000071e2 d49e09 .apex/co....q... ... 0000007291770980 b400007291770988 000000000000f fff ..w.r...........
恰好 *(this + 0x388) 的值就是 0xffff !这说明可能存在某些代码错误地将这里的值改成了 0xffff 。
动态分析 因此我们修改代码, hook IsMethodBeingCompiled 打印出 this 的值,并且判断 *(this+0x388)==0xffff (即问题是否发生),给用户测试。我们观察到这个 0xffff 并非一开始就存在,且 IsMethodBeingCompiled 的调用频率也并不低。
为了调查是谁污染了这个地址,我们使用 stackplz 的硬件断点功能,让用户在设备上运行 stackplz 捕获堆栈。
1 2 ./stackplz --pid `pidof system_server` --brk $((thiz+0 x388)):w --stack
经过一天的等待,我们得到了 crash 前的堆栈,我们发现对这个地址的写入大部分情况下来自这个调用:
1 2 3 4 5 [2045 |4248 ] event_addr:0x7b3df41388 hit_count:12272 , Stackinfo: #00 pc 000000000042e638 /apex/com.android.art/lib64/libart.so (art::jit::JitCodeCache::ResetHotnessCounter(art::ArtMethod*, art::Thread*)+136 ) #01 pc 0000000000422f e0 /apex/com.android.art/lib64/libart.so (art::jit::Jit::EnqueueOptimizedCompilation(art::ArtMethod*, art::Thread*)+48 ) #02 pc 0000000000229 d40 /apex/com.android.art/lib64/libart.so (art_quick_compile_optimized+160 ) #03 pc 00000000021682 c8 /memfd:jit-cache (deleted) (offset 0x2000000 )
由于上面的 stackplz 没有打印出 +0x388 处的具体值或按照它过滤,因此暂时无法确认就是这个函数的问题。
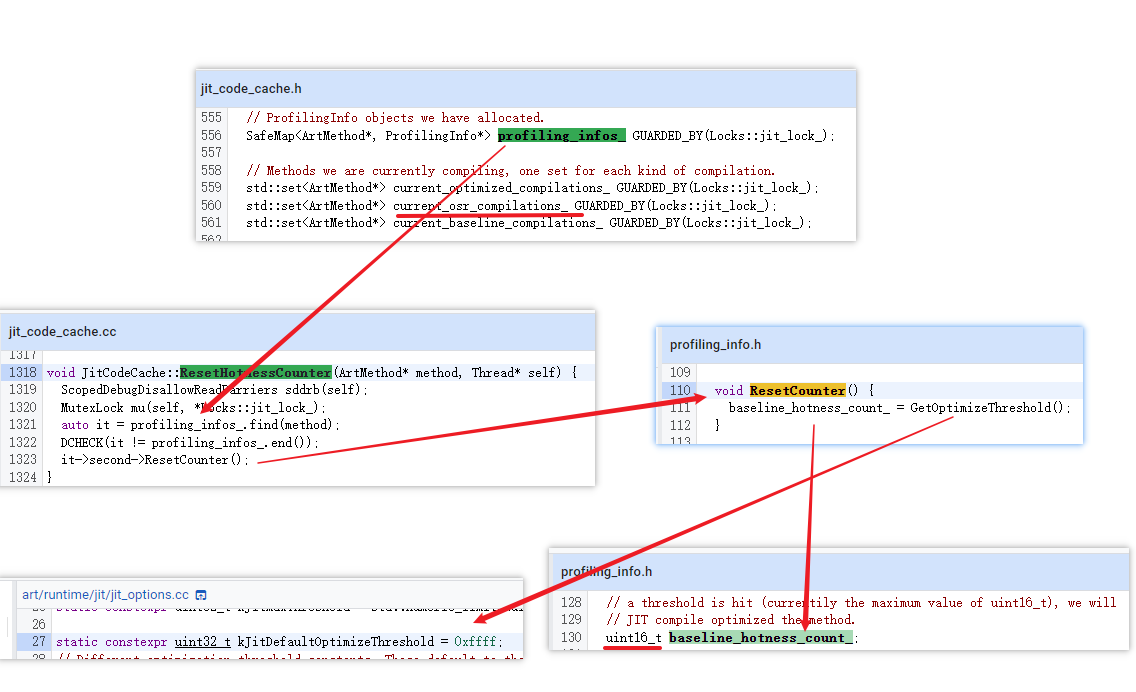
深入 ResetHotnessCounter 然而在分析了一下源码之后,发现这个函数来头不小,直指矛盾的中心。直接上图:
观察可知,这个函数试图往一个 map profiling_infos_ 的迭代器返回的地址写入值,而写入的值恰好是 0xffff 。
在内存布局上,这个 profiling_info_ 恰好又在那几个 set 上方,因此如果传入的 method 无法在这个 map 中被找到,那么返回了 iterator end ,就有可能发生意外的越界写,从反汇编来看确实如此。
看上去似乎是这部分代码的逻辑存在问题。然而代码对于 find 得到 end 的情形仅有 DCHECK ,即 debug 期的检查,说明这里设计上是总可以被找到的,应该是 LSPosed 的修改导致了问题。
初步结论:被 jit 后的方法被 hook 因此,我们又给用户编译了一个版本,用于跟踪是哪一个 artMethod 在 profiling_infos_ 找不到。
我们 hook 了 AddProfilingInfoInternal 和 ResetHotnessCounter 函数,发现是一个被 hook 的方法的 backup 被传入了 ResetHotnessCounter 而不存在于 profiling_infos_ ,更进一步地,我们发现这个方法在被 hook 前就已经被 jit 优化。
按照事件发生的顺序的日志如下:
1 2 3 4 5 6 7 8 9 10 11 12 13 14 AddProfilingInfoInternal: adding 0x7541b282c0 AddProfilingInfoInternal: adding 0x7541b282c0 result 0x759f628820 Done hook: target (0x7541b282c0 :0x1a200001 ) -> 0x764749a0c0 ; backup (0x74dc522020 :0x1a200002 ) -> 0x9c0c2580 ; hook (0x74dc522040 :0x12280009 ) -> 0x75c05ef260 ResetHotnessCounter: no profilingInfo found for 0x74dc522020 (count 1 ) !!! ResetHotnessCounter: method 0x74dc522020 boolean com.android.server.pm.AppsFilterBase.shouldFilterApplication (com.android.server.pm.snapshot.PackageDataSnapshot, int , java.lang.Object, com.android.server.pm.pkg.PackageStateInternal, int ) flags=0x1a200002 entry=0x9c0c2580 info 0x0 lastNotFound 0x0 0000000'9 c051000-00000000'9e050 fff r-x 2000000 2000000 /memfd:jit-cache (deleted)
我们还跟踪了 AddProfilingInfoInternal 和 ResetHotnessCounter 的调用堆栈(后者是导致 find artMethod == end 的时候)
借助 bionic 的信号处理机制,通过 raise(35) 可以使用系统 crash dumper 打印当前堆栈
1 2 3 4 5 6 7 8 9 10 11 12 13 14 15 16 17 18 19 20 21 22 23 24 25 26 27 28 29 30 31 32 33 34 35 36 37 #00 pc 00000000000 ec788 /apex/com.android.runtime/lib64/bionic/libc.so (tgkill+8 ) (BuildId: 84 a42637b3a421b801818f5793418fca) #01 pc 000000000003445 c /memfd:jit-cache (deleted) #02 pc 000000000042 ebc4 /apex/com.android.art/lib64/libart.so (art::jit::JitCodeCache::AddProfilingInfo (art::Thread*, art::ArtMethod*, std::__1::vector<unsigned int , std::__1::allocator<unsigned int > > const &)+68 ) (BuildId: bfccbd9698a0ee7ef72cfa3ee7389215) #03 pc 0000000000435030 /apex/com.android.art/lib64/libart.so (art::ProfilingInfo::Create (art::Thread*, art::ArtMethod*)+528 ) (BuildId: bfccbd9698a0ee7ef72cfa3ee7389215) #04 pc 0000000000430254 /apex/com.android.art/lib64/libart.so (art::jit::JitCodeCache::NotifyCompilationOf (art::ArtMethod*, art::Thread*, art::CompilationKind, bool )+756 ) (BuildId: bfccbd9698a0ee7ef72cfa3ee7389215) #05 pc 000000000041b 508 /apex/com.android.art/lib64/libart.so (art::jit::Jit::CompileMethodInternal (art::ArtMethod*, art::Thread*, art::CompilationKind, bool )+872 ) (BuildId: bfccbd9698a0ee7ef72cfa3ee7389215) #06 pc 00000000004266 ec /apex/com.android.art/lib64/libart.so (art::jit::JitCompileTask::Run (art::Thread*)+684 ) (BuildId: bfccbd9698a0ee7ef72cfa3ee7389215) #07 pc 00000000006 cb810 /apex/com.android.art/lib64/libart.so (art::ThreadPoolWorker::Run ()+112 ) (BuildId: bfccbd9698a0ee7ef72cfa3ee7389215) #08 pc 00000000006 cb2c0 /apex/com.android.art/lib64/libart.so (art::ThreadPoolWorker::Callback (void *)+176 ) (BuildId: bfccbd9698a0ee7ef72cfa3ee7389215) #09 pc 0000000000101 d5c /apex/com.android.runtime/lib64/bionic/libc.so (__pthread_start(void *)+204 ) (BuildId: 84 a42637b3a421b801818f5793418fca) #10 pc 0000000000095b c0 /apex/com.android.runtime/lib64/bionic/libc.so (__start_thread+64 ) (BuildId: 84 a42637b3a421b801818f5793418fca) #00 pc 00000000000 ec788 /apex/com.android.runtime/lib64/bionic/libc.so (tgkill+8 ) (BuildId: 84 a42637b3a421b801818f5793418fca) #01 pc 0000000000034188 /memfd:jit-cache (deleted) (lsposed) #02 pc 0000000000422f e0 /apex/com.android.art/lib64/libart.so (art::jit::Jit::EnqueueOptimizedCompilation (art::ArtMethod*, art::Thread*)+48 ) (BuildId: bfccbd9698a0ee7ef72cfa3ee7389215) #03 pc 0000000000229 d40 /apex/com.android.art/lib64/libart.so (art_quick_compile_optimized+160 ) (BuildId: bfccbd9698a0ee7ef72cfa3ee7389215) #04 pc 0000000002062 df0 /memfd:jit-cache (deleted) (offset 0x2000000 ) (com.android.server.pm.AppsFilterBase.shouldFilterApplication+1568 ) (jit cache) #05 pc 00000000002109 a4 /apex/com.android.art/lib64/libart.so (art_quick_invoke_stub+612 ) (BuildId: bfccbd9698a0ee7ef72cfa3ee7389215) #06 pc 0000000000253b 0c /apex/com.android.art/lib64/libart.so (art::ArtMethod::Invoke (art::Thread*, unsigned int *, unsigned int , art::JValue*, char const *)+172 ) (BuildId: bfccbd9698a0ee7ef72cfa3ee7389215) #07 pc 000000000064b 734 /apex/com.android.art/lib64/libart.so (_jobject* art::InvokeMethod <(art::PointerSize)8 >(art::ScopedObjectAccessAlreadyRunnable const &, _jobject*, _jobject*, _jobject*, unsigned long )+1588 ) (BuildId: bfccbd9698a0ee7ef72cfa3ee7389215) #08 pc 00000000005 c3800 /apex/com.android.art/lib64/libart.so (art::Method_invoke (_JNIEnv*, _jobject*, _jobject*, _jobjectArray*) (.__uniq.165753521025965369065708152063621506277 )+32 ) (BuildId: bfccbd9698a0ee7ef72cfa3ee7389215) #09 pc 00000000000 a2578 /system/framework/arm64/boot.oat (art_jni_trampoline+120 ) (BuildId: ef0baacfbe47e6c11614583471d5d5b98b1584c5) #10 pc 00000000002109 a4 /apex/com.android.art/lib64/libart.so (art_quick_invoke_stub+612 ) (BuildId: bfccbd9698a0ee7ef72cfa3ee7389215) #11 pc 0000000000253b 0c /apex/com.android.art/lib64/libart.so (art::ArtMethod::Invoke (art::Thread*, unsigned int *, unsigned int , art::JValue*, char const *)+172 ) (BuildId: bfccbd9698a0ee7ef72cfa3ee7389215) #12 pc 000000000064 d14c /apex/com.android.art/lib64/libart.so (art::JValue art::InvokeVirtualOrInterfaceWithVarArgs <art::ArtMethod*>(art::ScopedObjectAccessAlreadyRunnable const &, _jobject*, art::ArtMethod*, std::__va_list)+460 ) (BuildId: bfccbd9698a0ee7ef72cfa3ee7389215) #13 pc 000000000064 d3dc /apex/com.android.art/lib64/libart.so (art::JValue art::InvokeVirtualOrInterfaceWithVarArgs <_jmethodID*>(art::ScopedObjectAccessAlreadyRunnable const &, _jobject*, _jmethodID*, std::__va_list)+92 ) (BuildId: bfccbd9698a0ee7ef72cfa3ee7389215) #14 pc 0000000000480984 /apex/com.android.art/lib64/libart.so (art::JNI<false >::CallObjectMethodV (_JNIEnv*, _jobject*, _jmethodID*, std::__va_list)+660 ) (BuildId: bfccbd9698a0ee7ef72cfa3ee7389215) #15 pc 0000000000044e78 /memfd:jit-cache (deleted) (lsposed) #16 pc 00000000000518 d8 /memfd:jit-cache (deleted) (lsposed) #17 pc 00000000020b 19cc /memfd:jit-cache (deleted) (offset 0x2000000 ) (art_jni_trampoline+156 ) (jit cache) #18 pc 000000000207 c10c /memfd:jit-cache (deleted) (offset 0x2000000 ) (org.lsposed.lspd.impl.LSPosedBridge$NativeHooker.callback+1756 ) (jit cache) #19 pc 000000000020 a330 /apex/com.android.art/lib64/libart.so (nterp_helper+4016 ) (BuildId: bfccbd9698a0ee7ef72cfa3ee7389215) #20 pc 00000000000002 ce [anon:dalvik-DEX data] (LSPHooker_.shouldFilterApplication+62 ) #21 pc 00000000020b e8f0 /memfd:jit-cache (deleted) (offset 0x2000000 ) (com.android.server.pm.ComputerEngine.shouldFilterApplication+1696 )
因此,结论上来看,是 lsplant 对已经 jit 的 ArtMethod (且被加入到 profiling_infos_ )进行了 hook 后,调用被 hook 方法导致调用 ResetHotnessCounter ,并传入了错误的 ArtMethod 地址导致错误写入,从而在其他 jit 编译发生的时候调用 IsMethodBeingCompiled 时访问错误的地址。
此时我们发现一个现象:如果第一次正常启动,则手动触发软重启(即杀掉 zygote)的下一次 zygote 启动后大概率会立即触发这个 bug ,这大大地加快了调试的进程。而且,我们注意到触发这个 bug 很多时候是因为 HMA hook 了 shouldFilterApplication ,而这个方法在系统启动的时候会因为计算包可见性缓存而被频繁调用,因此存在 HMA 的情况下就有很大的概率触发。但是仍然没法解释为什么第一次启动大概率不会出现问题,而是要等系统运行很久才发生问题。
此外,系统的 jar 一般都应该是被优化编译的,且 oat 保存在系统镜像中,正常情况下 oat 与 dex 匹配,只要方法被 aot 优化了就不再需要 jit 。但是为什么这里 hook 的方法虽然在 services.jar 中,却需要 jit 编译呢?jit 编译为什么先于 hook 触发呢?这些还需要进一步调查。不过,有人反馈使用了 FrameworkPatcherGo 等模块也触发了这个 bug ,显然这种替换 jar 的模块会导致已有的 oat 失效,因此使用 jit 是正常情况。
临时修复 我给出了一个修复 ,通过 hook ResetHotnessCounter ,检查 ArtMethod 是否在 profiling_infos_ 中,如果不在,则尝试从 hook 记录中查找备份方法的原方法并传入给原函数。
稳定复现 尽管上文提到在特定系统中手动软重启可以快速复现,但是我们仍然需要一个稳定的触发方法。
TODO
进一步分析 未完待续